Wondercare
Best Tool in India
ListingPilot replied
Thank you, Wondercare. Your team pushed us hard on returns and settlement accuracy, and the product is better for it.
ListingPilot is an Amazon seller analytics dashboard for India-first FBA and brand sellers that joins Selling Partner API (SP-API) orders, returns, settlements and inventory with Amazon Ads API spend — so sales, ACOS, ROAS, TACoS, organic vs sponsored share, return rate, settlement payouts, state-wise demand, Listing Quality Score and BSR are reported on one base, per ASIN and per marketplace, from ₹8,999/month.
Seller Central already has a lot of numbers. The problem is where they live: sales and traffic in Business Reports, ad spend in the Amazon Ads console, fees and payouts in payment reports, returns and stock in FBA reports. Every serious question — “is advertising growing this ASIN or just buying its sales?”, “why is the payout lower than the sales?”, “which states should my stock sit closer to?” — needs two or three of those joined first.
This page explains what Amazon seller analytics should cover, what Amazon’s own reports give you (based on Amazon’s public pages, checked 9 October 2026), where the gaps are, and which metrics ListingPilot reports once SP-API and Ads API data sit in one dashboard.
Amazon seller analytics is the reporting layer that answers four questions for every ASIN and marketplace:
A daily view of sales alone is a sales tracker. Seller analytics is the joined view: the same ASIN’s sales, spend, returns and payout side by side, so the numbers agree. If you only need the daily sales view, the Amazon sales tracker page covers that in detail.
Amazon’s native reports are free, official and the right source for some metrics. The table summarises what each one provides according to Amazon’s own public pages, and what you still have to join yourself to get decision-ready analytics.
| Amazon report | What it gives you (per Amazon) | What you still have to join |
|---|---|---|
| Business Reports — Sales dashboard | Sales in graphs or tables, filters by date and fulfilment channel, comparison with previous periods, data download. | Account-level view; no ad spend, fees or payouts next to the sales line. |
| Business Reports — Sales and Traffic / Detail Page Sales and Traffic (by date, parent and child ASIN) | Ordered product sales, units ordered, order items, sessions, page views, Featured Offer (Buy Box) %, unit session % (conversion) and refund rate; downloadable as .csv. | No ad-spend field, so no TACoS or organic vs sponsored split without the Ads console. |
| Brand Analytics (Brand Registry, Professional account, Brand Representative role) | Search Query Performance, Search Catalog Performance, Top Search Terms, Repeat Purchase Behavior, Market Basket Analysis, Customer Loyalty Analytics and Demographics (US store only). | Search and customer-behaviour data; Search Query Performance is reported by week, month or quarter, not day-by-day sales or profit. |
| FBA, payments and tax reports | Customer Shipment Sales (with destination), FBA Customer Returns (with reason), Inventory Ledger, reimbursements, settlement and GST reports. | Separate downloads: state-wise demand, return reasons and payouts each live in their own file. |
Sources (checked 9 October 2026): Amazon’s “Get actionable B2B insights with Amazon business reports” and “5 ways to use Amazon seller dashboards and tools” (sell.amazon.com), the Brand Analytics tool page and blog (sell.amazon.com), the SP-API Analytics Reports reference for the Sales and Traffic report (developer-docs.amazon.com), and the FBA Business Reports help page (sellercentral.amazon.in). Amazon can change these reports at any time.
Keep Business Reports for sessions, page views, Featured Offer (Buy Box) percentage and unit session percentage — ListingPilot does not report traffic or conversion today. Keep Brand Analytics for search query share, market basket and repeat-purchase data if you are brand-registered. The gaps ListingPilot fills are the ones those reports leave between them.
These are the metrics the ListingPilot dashboards report today. Each is built from SP-API data, Amazon Ads API data, or both, and can be viewed per parent ASIN, child ASIN and marketplace.
| Metric | How it is built | Where you see it |
|---|---|---|
| Sales, units, orders, AOV, ASP | SP-API orders, per parent and child ASIN and per marketplace | Dashboard KPIs, Sales Intelligence, date-wise calendar |
| Growth vs previous period | Current window vs previous window (e.g. last month, last year same day) | Dashboard, Sales Intelligence |
| Organic vs sponsored sales and share | SP-API total sales split against Ads API attributed sales | Sales Intelligence, TACoS tracker |
| ACOS, ROAS, ad spend, ad sales | Amazon Ads API (Sponsored Products) | Ads dashboard and PPC views (Ads features from Gold) |
| TACoS | Ads API spend ÷ SP-API total sales, same period and marketplace | Dashboard KPI, Ads dashboard, TACoS tracker |
| Returns, return rate, refunds, return reasons | SP-API returns and refunds per parent and child ASIN | Dashboard, Returns command center |
| Settlement payouts | Gross sales, Amazon fees, refunds and bank deposit per settlement; expected vs received | Payments and Reconciliation |
| Net profit and margin | Sales minus fees, ads, returns and your per-SKU costs | P&L (from Gold, with SKU cost master) |
| State-wise demand and FBA stock by FC | Order ship-to state; FBA warehouse ledger by region and fulfilment centre | Sales Command Center (amazon.in) |
| Listing Quality Score (LQS) | 0–100 per ASIN from seven weighted components | Listings and LQS views |
| BSR and sub-BSR | Best Sellers Rank trend per ASIN | Sales Intelligence, competitor comparison |
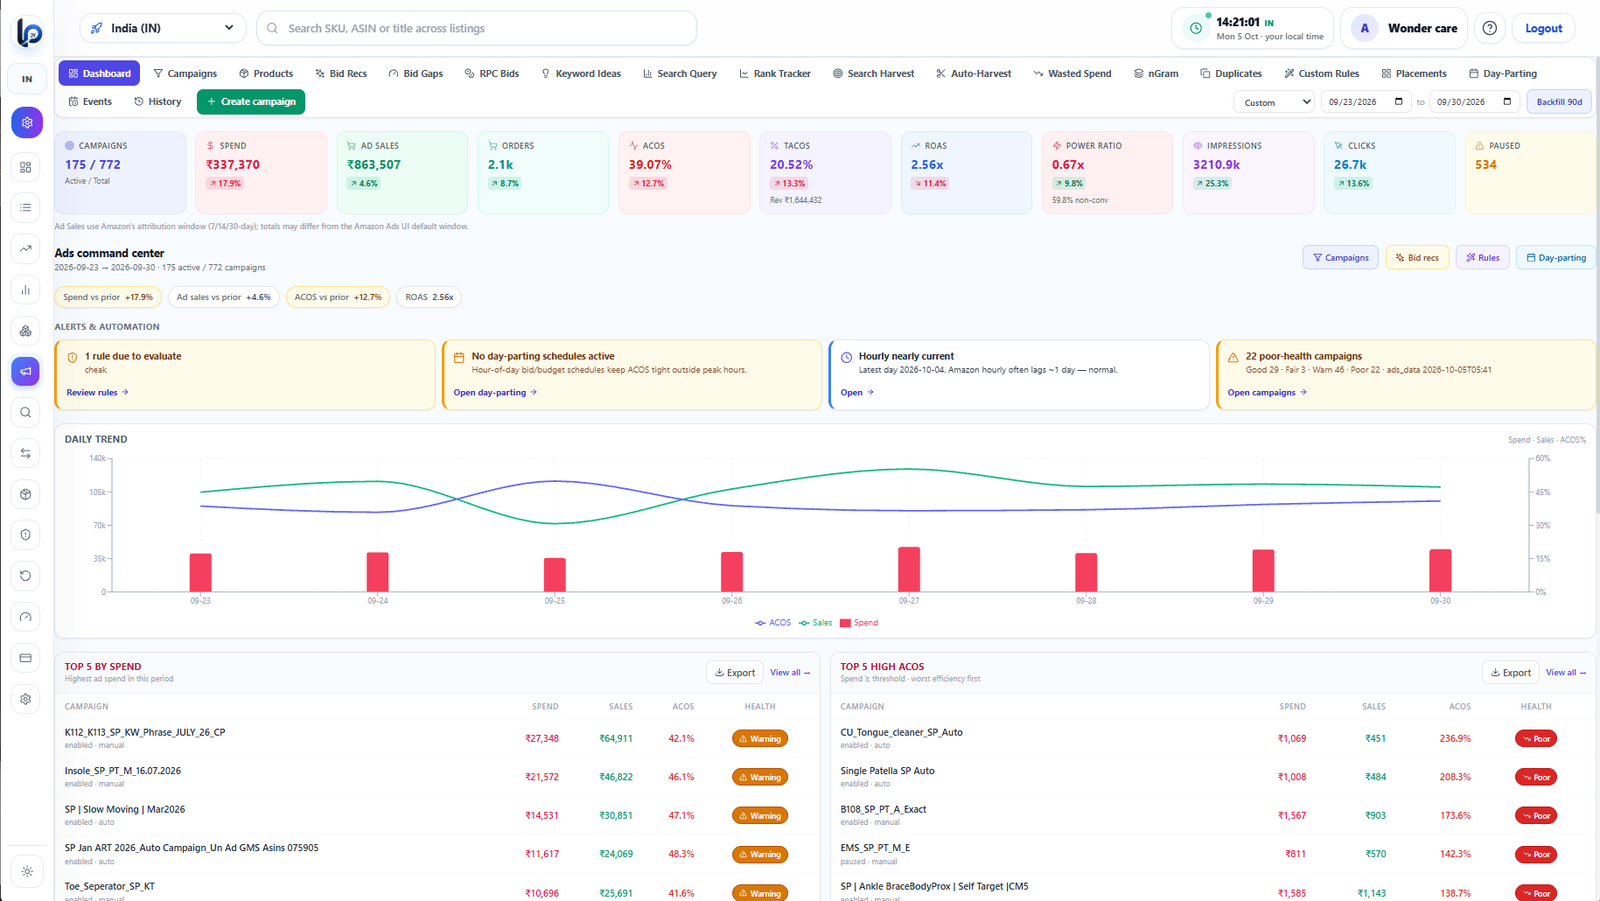
ACOS (ad spend ÷ ad-attributed sales) and ROAS come straight from the Amazon Ads API. TACoS divides the same ad spend by total SP-API sales for the same dates and marketplace, which is why the two sources have to be joined. The TACoS tracker explains how to read the trend per ASIN, and the Amazon PPC dashboard goes deeper into campaigns, wasted spend and bid gaps.
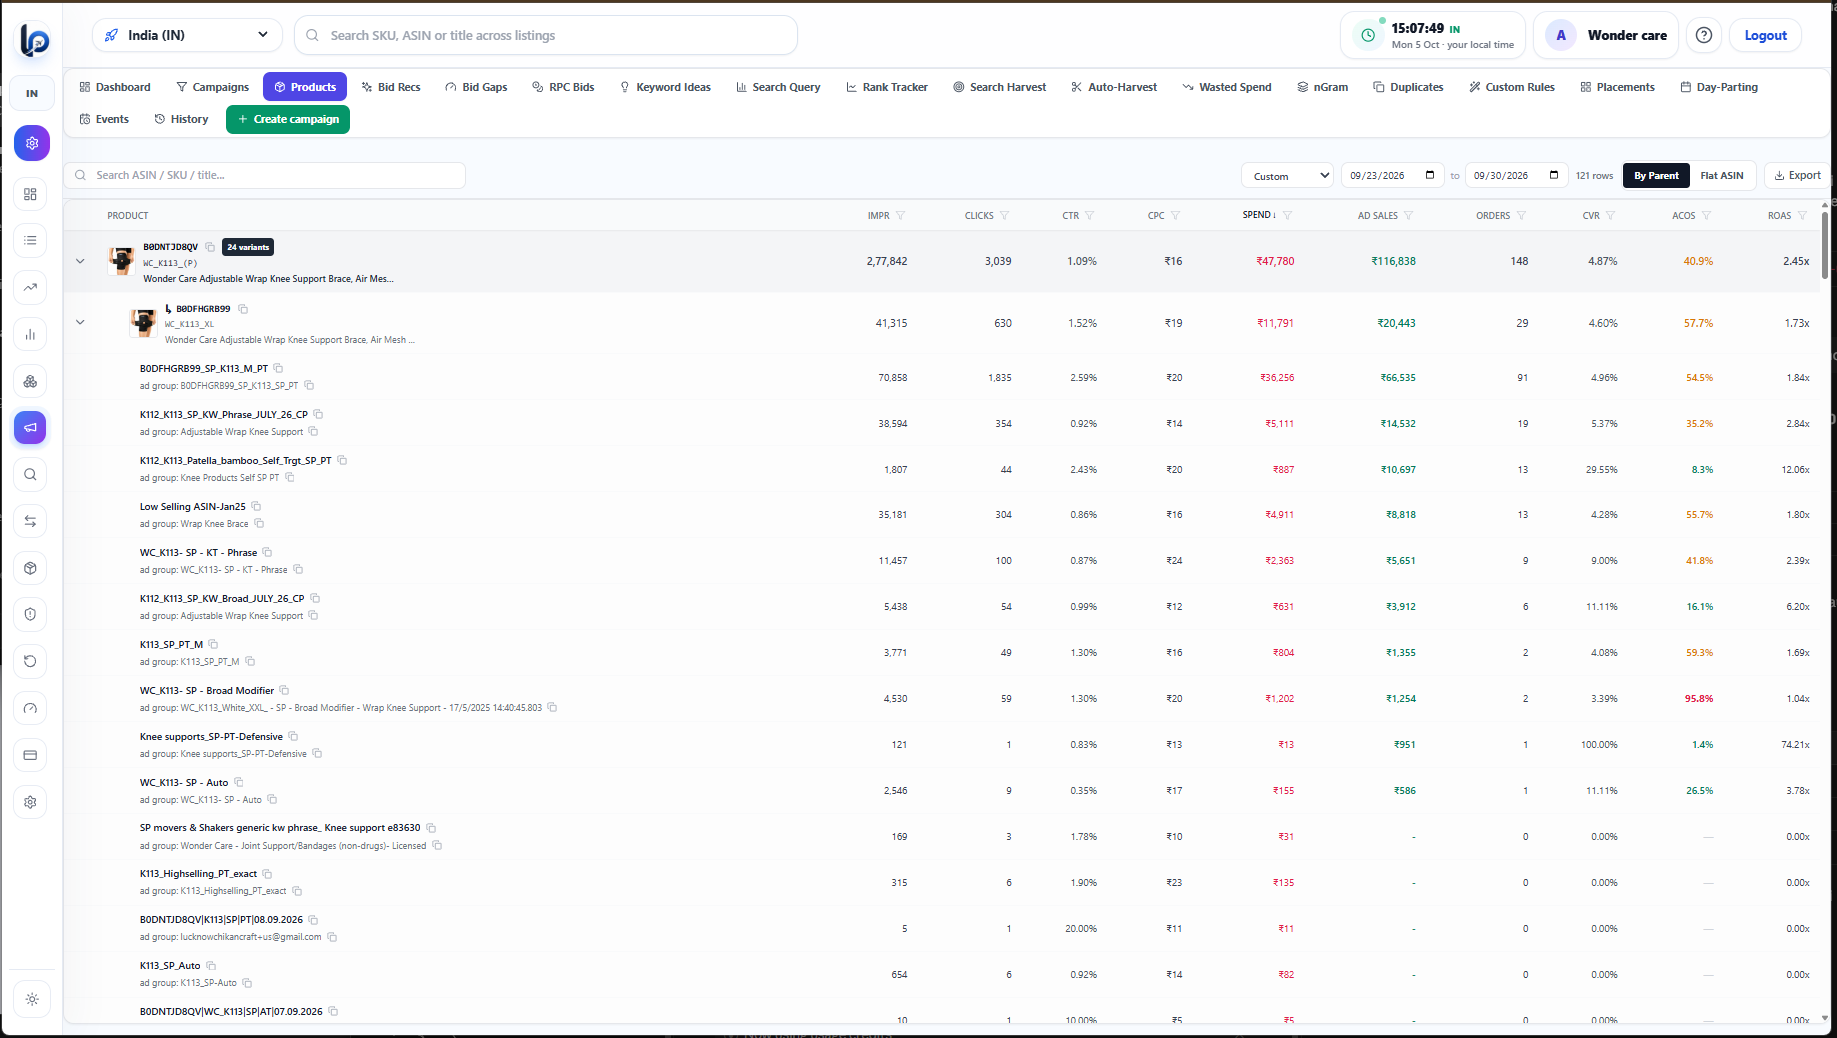
Sales Intelligence keeps total, organic and sponsored sales in separate lanes, with organic and sponsored share, AOV, ASP, return rate, settlement amount and BSR trend per ASIN. It also flags products whose sales fell more than 20% against the previous comparable window, SKUs forecast to stock out within 30 days at current velocity, and products with weak organic share. Recommended next steps are suggestions only — nothing is changed in your account without you.
The returns view ranks parent and child ASINs by return rate and groups returns by reason, so a quality problem shows up as a pattern rather than a single refund. On the money side, Payments shows gross sales, Amazon fees, refunds and bank deposits with a settlement overview and order-level ledger, and settlement reconciliation matches delivered orders to expected net payouts, flags missing payments and marks discrepancies. With SKU costs added (from Gold), the P&L dashboard turns the same data into net profit and margin per SKU. Details on returns: Amazon return management.
Analytics that only show money miss the cause. ListingPilot scores every ASIN 0–100 with the Listing Quality Score (title, bullets, images, A+, pricing and Buy Box, reviews, inventory), tracks BSR per ASIN, and lets you benchmark revenue, sales, LQS, BSR, sub-BSR, rating, reviews, ad spend and returns across your own or peer ASINs. Tables export to CSV, Excel or PDF for finance and agency reporting.
For the wider India picture — GST, settlement cycles and INR billing as a buying decision — see Amazon seller software for India.
Each module below has its own page with the full workflow.
Daily units, revenue and organic vs sponsored per ASIN and marketplace.
Amazon India orders by buyer state and FBA stock by fulfilment centre.
ACOS, ROAS, campaign health, wasted spend and bid gaps.
Ad spend ÷ total sales per ASIN, with organic dependency.
Expected vs received payouts, missing payments and discrepancies.
Return rate and reasons by ASIN and marketplace.
0–100 score per ASIN with the sub-score that drags it down.
Net profit per SKU after fees, ads, returns and COGS.
Want the full module list, including listing edits and PPC automation? See the all-in-one Amazon tool overview.
| Plan | Special price (50% off) | List price | Analytics highlights |
|---|---|---|---|
| Silver | ₹8,999/mo | ₹17,999/mo | Sales & returns dashboards, listing health; 1 marketplace |
| Gold (recommended) | ₹11,999/mo | ₹24,999/mo | Everything in Silver + Amazon Ads analytics, P&L and SKU cost master; up to 3 marketplaces |
| Diamond | ₹16,999/mo | ₹33,999/mo | Everything in Gold + advanced sales analytics; up to 7 marketplaces |
The special price is valid for 3 months from signup and quarterly billing saves 10%. There is no free trial — open the demo dashboard first, then sign up. Full plan details are on the pricing page.
Amazon, Seller Central, Brand Analytics and Amazon Ads are trademarks of Amazon.com, Inc. or its affiliates. ListingPilot uses Amazon’s official Selling Partner API and Amazon Ads API and is not affiliated with or endorsed by Amazon. Descriptions of Amazon reports are summarised from Amazon’s public pages as of 9 October 2026.
Shashank built ListingPilot’s SP-API and Ads API integration. Tell us at support@listingpilot.in if anything on this page is out of date.
Connect your marketplaces, explore the demo dashboard, or sign up — 50% off special pricing. Early users may get up to 5–10% additional off for a limited time.
Best Tool in India
Thank you, Wondercare. Your team pushed us hard on returns and settlement accuracy, and the product is better for it.
Best for sales analytics — first time something like this in India. I am so happy.
Thank you, Hulara. Sales analytics was the first thing we built, so this means a lot.
Nice tool. It will help Amazon sellers a lot.
Thank you, Febcart. Glad it is proving useful for your team.
Nice tool.
Thank you, Kraftwila.
It is all very good for Amazon sellers.
Thank you, Monozo. Multi-marketplace sellers like you shaped a lot of the dashboard.
I like it, but you need to upgrade it more.
Thank you for the honest feedback, Jaipurartmart. Tell us which part you want improved next and we will put it on the roadmap.