If you sell on amazon.in, Advertising Console shows you ACOS on every row, so it becomes the number you manage. But ACOS has a blind spot: it only sees orders Amazon attributes to an ad click. It cannot tell you whether ads are lifting your organic rank or whether sales stop the day you pause campaigns. TACoS fills that gap.
This guide covers both formulas, a worked example in rupees, when to use which metric, how the organic flywheel shows up in TACoS, and the mistakes that make a healthy-looking ACOS hide a weakening business. For the break-even side of the story, read what is a good ACOS on Amazon.
ACOS vs TACoS: definitions and formulas
| Metric | Formula | What it tells you |
|---|---|---|
| ACOS | Ad spend ÷ ad-attributed sales × 100 | How efficiently campaigns convert spend into ad sales |
| ROAS | Ad-attributed sales ÷ ad spend | The inverse of ACOS (ROAS 4 = ACOS 25%) |
| TACoS | Ad spend ÷ total sales × 100 | How much of total revenue goes to ads; ad dependence |
| Organic share | (Total sales − ad sales) ÷ total sales | Approximate share of sales not attributed to ads |
Notice the numerator is the same in ACOS and TACoS — ad spend. Only the denominator changes. ACOS divides by the slice of sales Amazon credits to ads; TACoS divides by everything you sold. That is why, for the same scope and period, TACoS normally comes out lower than ACOS.
Inputs that must match
- Same date range for spend and sales (watch attribution windows — recent days are still filling in).
- Same marketplace and currency — do not blend amazon.in rupees with another marketplace.
- Same tax treatment for sales (with or without GST) every time you compare periods.
- Same scope — all ASINs in a brand, or one parent ASIN, on both sides of the formula.
Worked example in ₹ (example numbers only)
One parent ASIN on amazon.in. Month 1 is the starting point. By Month 3 the seller has taken one of two paths. All figures are illustrative — not customer data.
| Scenario | Ad spend | Ad sales | Total sales | ACOS | TACoS |
|---|---|---|---|---|---|
| Month 1 (start) | ₹50,000 | ₹1,25,000 | ₹2,00,000 | 40% | 25% |
| Month 3 — Path A: keep investing | ₹50,000 | ₹1,25,000 | ₹3,12,500 | 40% | 16% |
| Month 3 — Path B: cut bids | ₹30,000 | ₹1,00,000 | ₹1,10,000 | 30% | 27.3% |
Path A: ACOS unchanged, TACoS falling
Spend and ad sales are identical to Month 1, so ACOS stays at 40% — an ACOS-only report would say “nothing improved”. But total sales grew from ₹2,00,000 to ₹3,12,500, so TACoS fell from 25% to 16%. Organic sales went from ₹75,000 to ₹1,87,500. The ads are doing their job: buying visibility that converts into rank and organic orders.
Path B: ACOS improved, TACoS worse
Bid cuts lowered spend to ₹30,000 and ACOS improved from 40% to 30%. But with less visibility, organic sales fell from ₹75,000 to ₹10,000 and total sales dropped to ₹1,10,000 — so TACoS rose to 27.3%. The campaign report looks better; the business is smaller and more ad-dependent.
When to use ACOS and when to use TACoS
| Decision | Use | Why |
|---|---|---|
| Raise or lower a keyword bid | ACOS (vs break-even ACOS) | Keyword-level efficiency; total sales are not attributable to one keyword |
| Harvest or negate search terms | ACOS + conversions | Search-term efficiency is an ad-side question |
| Set a monthly ad budget for an ASIN | TACoS (vs your TACoS ceiling) | Budget should be judged against all sales the ASIN makes |
| Decide if a launch is working | TACoS trend + organic share | Launch ACOS is expected to be high; the question is whether organic is rising |
| Compare brands or marketplaces | TACoS | Normalises ad spend against the size of each business |
| Report ad health to a founder or CFO | TACoS + total sales | Answers “are we growing, and how ad-dependent are we?” |
A useful habit: review ACOS daily or weekly inside campaigns, and TACoS weekly or monthly at parent-ASIN, brand and marketplace level. Short windows make TACoS noisy because organic sales lag ad changes.
The organic flywheel: why TACoS should fall over time
Amazon's organic ranking rewards products that sell. Ads put a product in front of shoppers for keywords it does not yet rank for; the resulting sales and conversion history can help organic rank on those same terms; better organic rank brings orders you did not pay for. When that loop is working, total sales grow faster than ad spend — and TACoS drifts down.
- Ads buy impressions and clicks on target keywords.
- Clicks convert into orders (helped by listing quality, price, reviews and stock).
- Sales velocity and conversion history support organic rank.
- Organic orders grow; total sales rise faster than spend.
- TACoS falls — giving you room to defend rank or reinvest in the next ASIN.
The flywheel stalls when something breaks conversion: a suppressed listing, a weak main image, lost Buy Box, stock-outs at FBA, or a price gap vs competitors. In those cases TACoS rises even if campaigns look fine — which is why it is worth reading TACoS next to listing health and inventory, not in isolation.
How to track ACOS and TACoS without spreadsheets
Doing this by hand means exporting an Advertising report, exporting a Business Report or order report, matching ASINs and dates, and fixing currency and tax differences every week. ListingPilot (we build it) joins Amazon Ads API spend with SP-API total sales and calculates TACoS for you:
- TACoS KPI on the Ads dashboard with total revenue and change vs the prior period.
- TACoS, ACOS, ad spend and revenue per ASIN in the sales command table, with parent-ASIN and brand roll-ups.
- Organic vs sponsored split and organic share per ASIN in Sales Intelligence.
- TACoS % as a condition in ads automation rules.
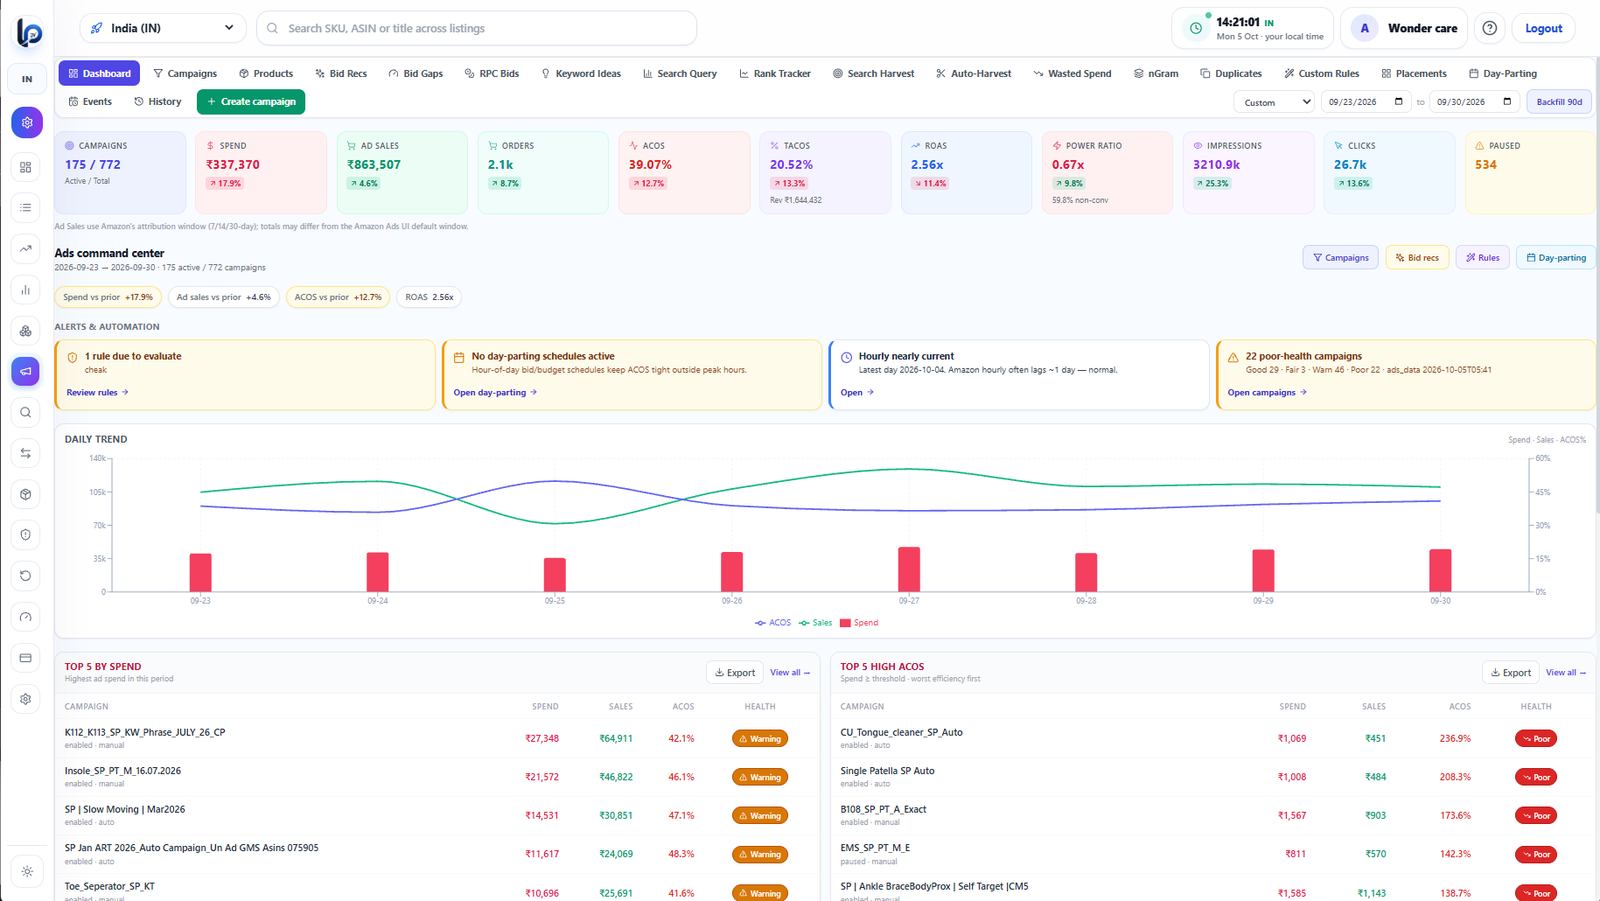
See what the tracker covers on the Amazon TACoS tracker page, or the Amazon PPC dashboard for campaign-level ACOS and ROAS.
Common ACOS and TACoS mistakes
- Using one ACOS target for every ASIN. Break-even ACOS depends on each product's margin. Work it out per SKU (see good ACOS guide).
- Reading TACoS as a daily number. Organic sales lag ad changes and recent ad sales are still being attributed. Look at weekly or monthly trends.
- Blending marketplaces. amazon.in TACoS and another marketplace's TACoS in different currencies and seasons should not be averaged together.
- Mismatched inputs. Spend for one date range and sales for another, or sales with GST in one month and without in the next.
- Cutting bids to “fix” ACOS without watching total sales. Path B in the example above is the classic outcome.
- Blaming ads for a conversion problem. If TACoS rises, check listing quality, Buy Box, reviews and stock before touching bids.
- Treating the organic split as exact. Attribution windows and halo sales make it an estimate — useful for trends, not accounting.
FAQs
What is the difference between ACOS and TACoS on Amazon?
How do I calculate TACoS on Amazon India?
Can ACOS go down while TACoS goes up?
What is a good TACoS for Amazon sellers in India?
Should I optimise campaigns for ACOS or TACoS?
Why is Amazon TACoS hard to track in Seller Central?
Does organic sales equal total sales minus ad sales?
Next steps
Start by writing down a break-even ACOS and a TACoS ceiling for your top five ASINs, then track both for four weeks. If you want this joined automatically per ASIN and marketplace, see the Amazon TACoS tracker (ads-connected views from Gold at ₹11,999/month, 50% off special) or compare plans. Evaluating tools? Read best Amazon PPC tool for India sellers.